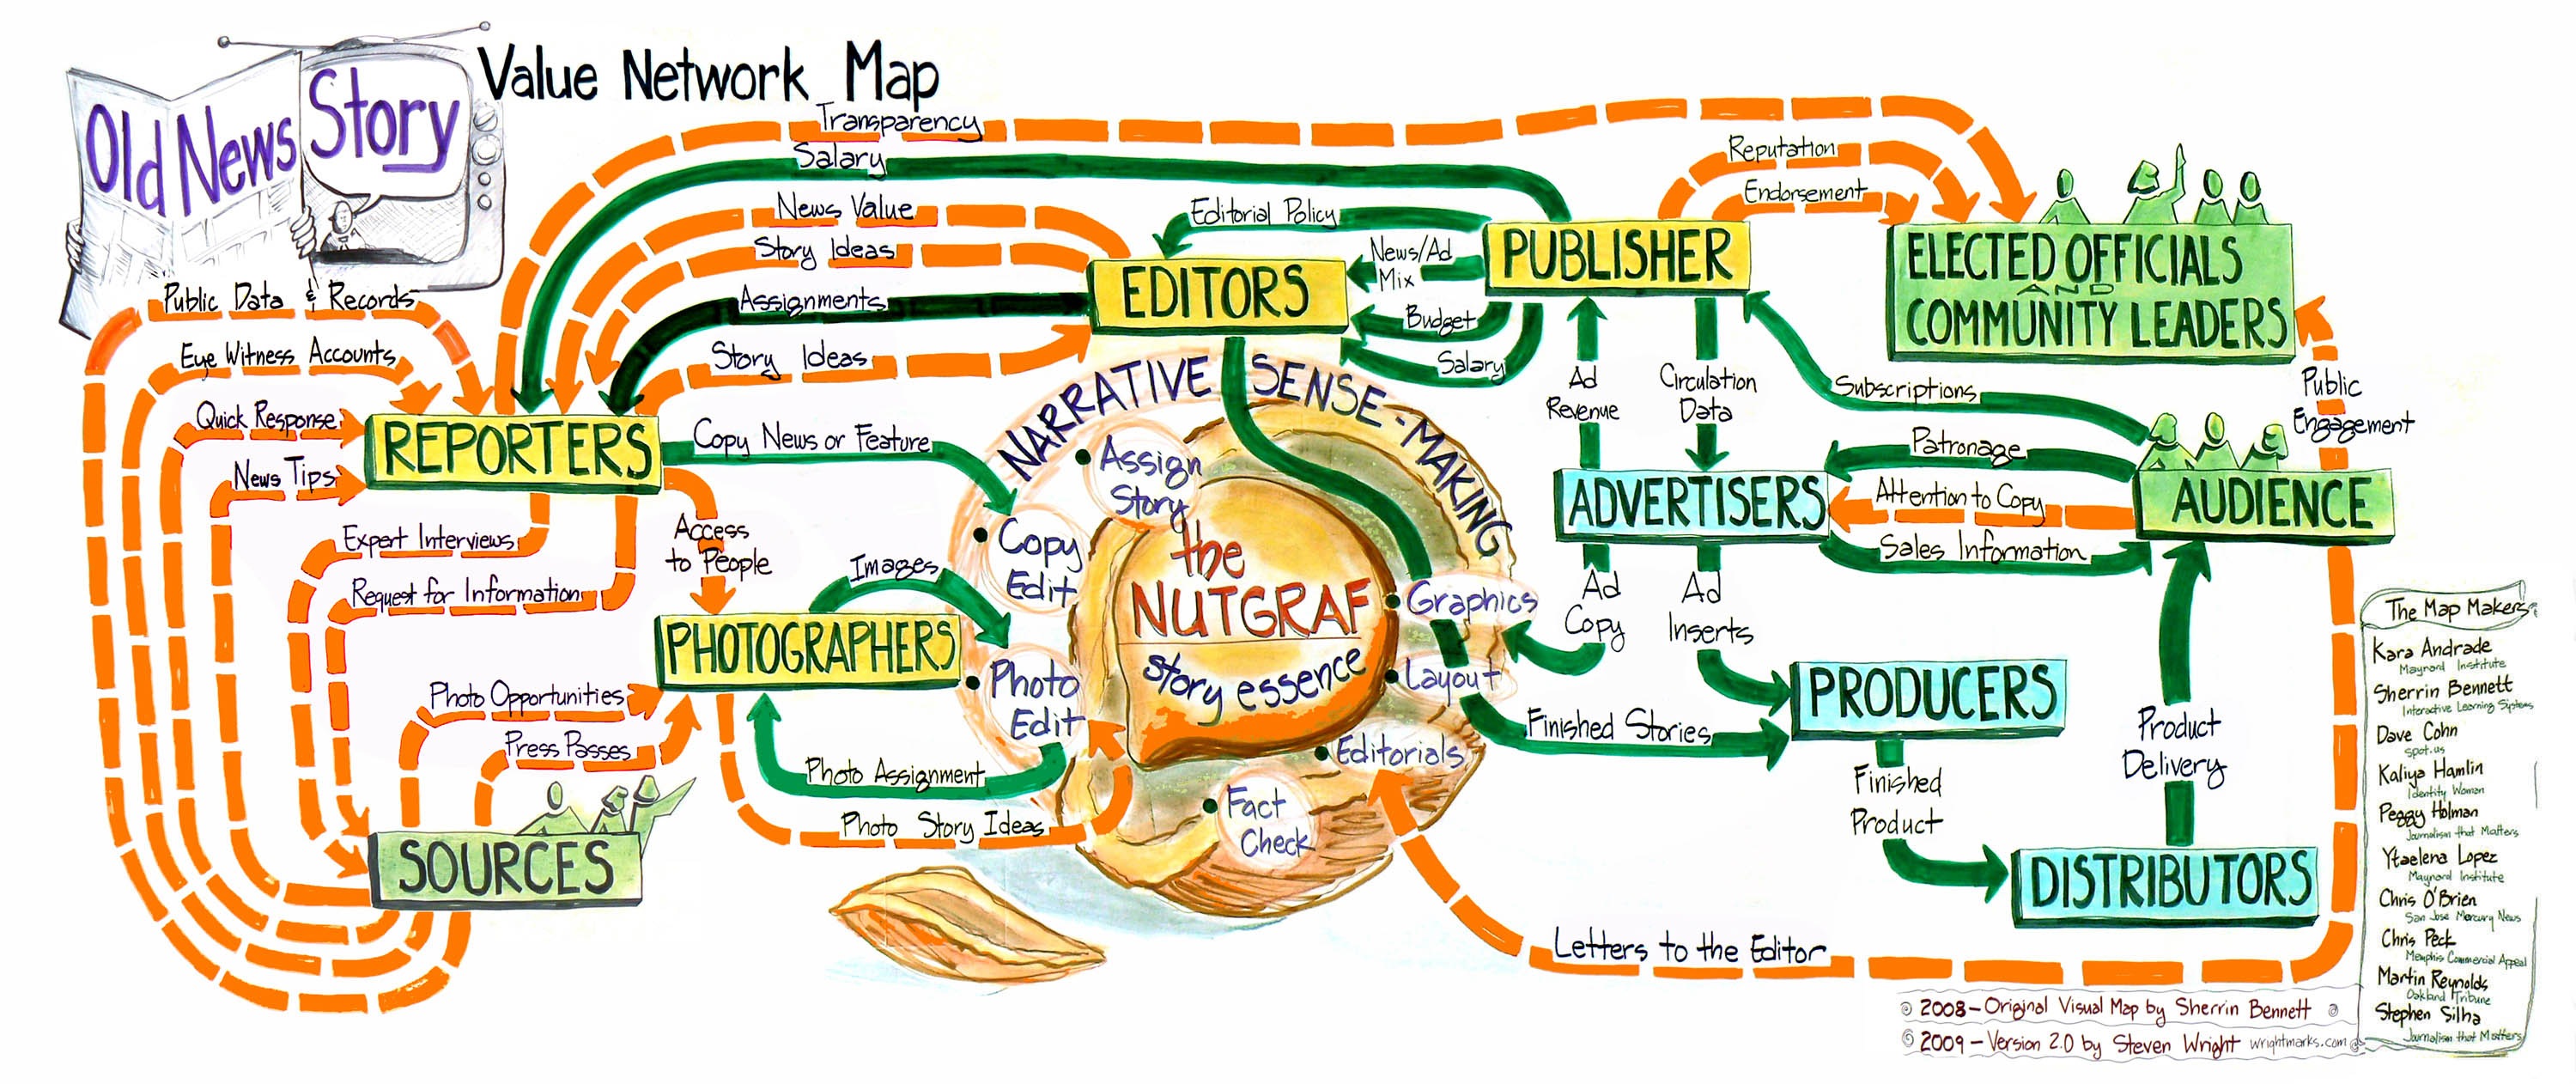
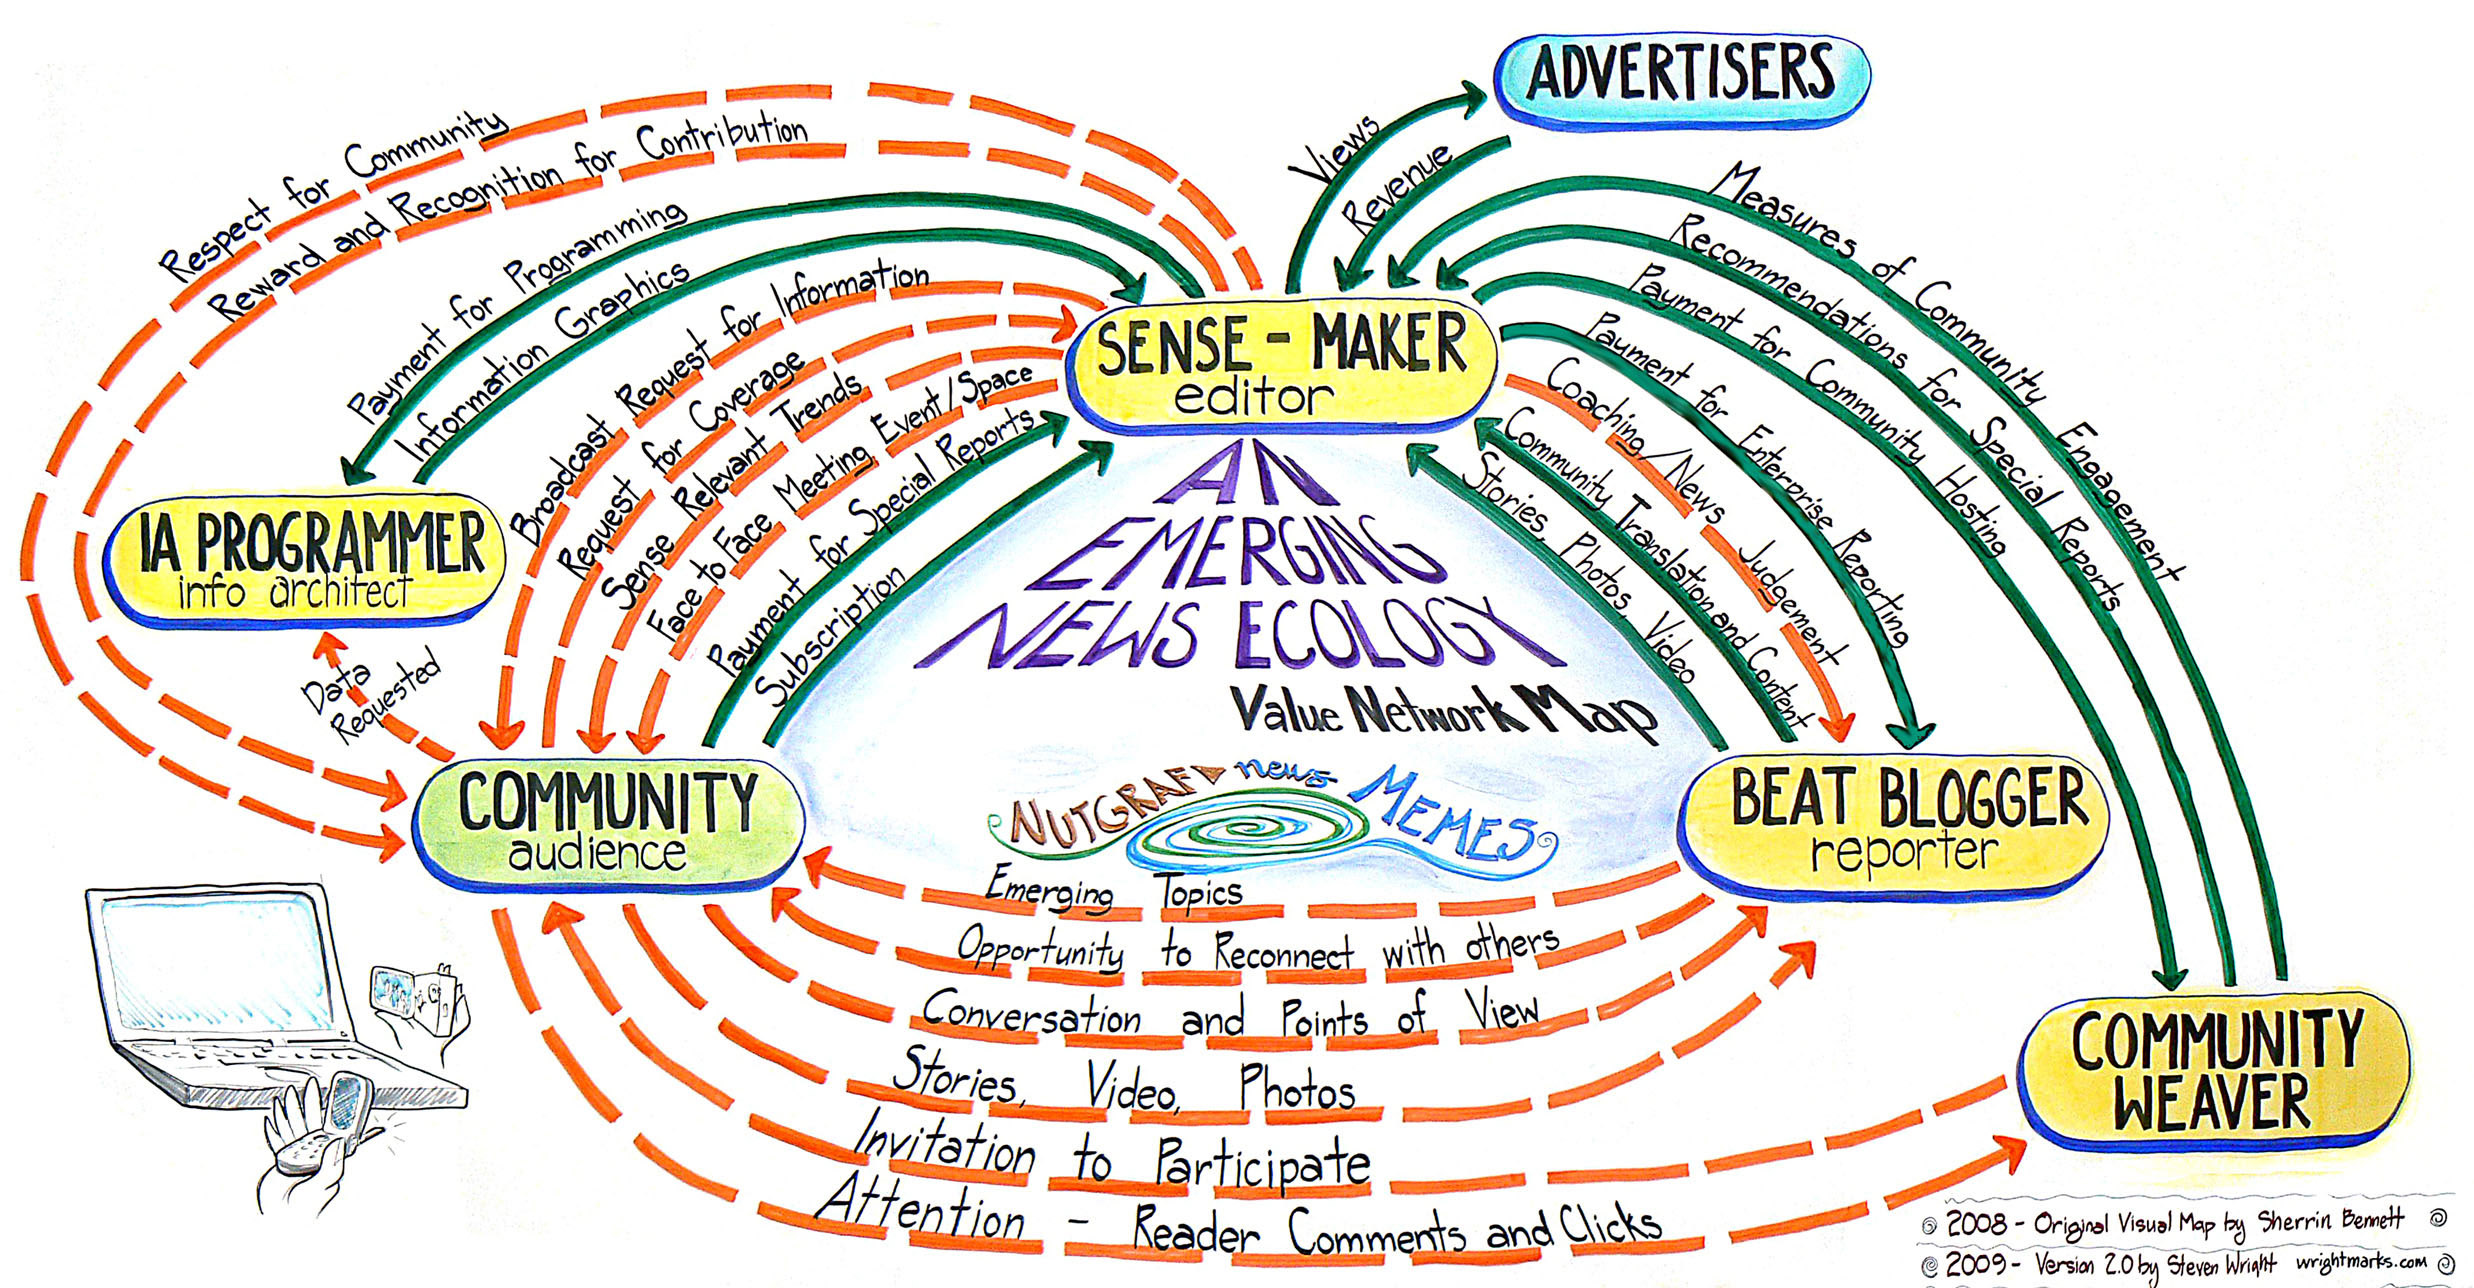
Created originally for Newstools 2008 in Silicon Valley, we re-made the value network maps for Journalism in the New News Ecology at the Poynter Institute. Here are the new images, along with the original text.
Old News Story: Value Network Map
For 150 years the editors of American newspapers ruled the media landscape.
The men at the helm of newsrooms, and most editors are male, set agendas.
They directed massive staffs of journalists whose work poured through an assembly line of cultivating sources, writing, editing, production, printing and delivery.
They operated as esteemed members of The Fourth Estate, imagining themselves as independent counterbalances to the forces of power.
The work of reporters, photographers, and editors became more than a craft. It grew to be a profession, with professional wages, benefits and perks.
The public’s appetite and loyalty to their work was immense.
Huge consumer audiences built around the newspapers at the first half of the 20th century. The newspapers pronounced, and the masses listened.
Later, as audiences shifted to television, which broadcast one way, and every household in America tuned in.
Through it all, the words, photos and editorial judgments of the newspaper and television newsrooms, editors, and reporters continued to set local and national agendas.
And it was a hugely profitable business model. Major department stores, auto dealers, and job-seekers aggregated around the news pages and the news content.
Profits for both commercial television stations and monopolistic newspapers rose to 30% or more as massiveadvertising dollars poured in a mass medium.
Then the world changed.
– Chris Peck
An Emerging News Ecology: Value Network Map
At the beginning of the 21st century, the World Wide Web changed the business and information distribution model for all media.
No longer were printing presses and transmission towers the only means of communication. A laptop and a broadband hookup did the same work, thank-you.
Journalists for a day, a weekend, or a cause began to supplant journalists at desks, with their pensions and a boss.
The audience formerly known as newspaper readers and television viewers awoke to the freedom of connectivity in a digital age. Virtual communities and international communities of interest transcended geographic communities and the sense of place.
In a flash, media expectations, models and roles all changed.
Media morphed into many-to-many conversations. Content emerged raw and unedited, rather than as carefully parsed verified tidbits produced by trained journalists.
Stories grew on their own, without an editor. Photos were shared without a darkroom.
Bloggers filled content gaps left open or once occupied by paid, professional reporters. User-generated content both encroached on and enriched the media. Money that once went to news content writers and editors began to flow instead to those who aggregated the news, but did not create it.
Public policy could be shaped by Matt Drudge working in his basement or by a YouTube video captured on a $100 digital camera.
The old media world staggered.
New roles and a new vocabulary have begun emerging.
Some reporters become “beat bloggers” tapping into networks of bloggers to bring complex stories into focus. “Community weavers” create a sense of community among the former audience and with formal news entities. “Information architects” make intelligible the vast amounts of data and images now available. While editorscontinue to be sense makers, connecting facts and making story lines visible, ultimately who filters news from noise, how it happens, and who pays for it is still unfolding. Even the definition of “news” is up for grabs asmemes — cultural units of information equivalent to genes in the body — replace an event orientation to story.
The new media world has opened the floodgates of opportunity.
– Chris Peck, Peggy Holman, and Stephen Silha
The Map Makers:
- Kara Andrade, Maynard Institute
- Sherrin Bennett, Interactive Learning Systems
- Dave Cohn, spot.us
- Kaliya Hamlin, Identity Woman
- Peggy Holman, Journalism that Matters
- Ytaelena Lopez, Maynard Institute
- Chris O’Brien, San Jose Mercury News
- Chris Peck, Memphis Commercial Appeal
- Martin Reynolds, Oakland Tribune
- Stephen Silha, Journalism that Matters
Value Network Mapping and Analysis
Prepared by Kaliya Hamlin
www.unconference.net
kaliya@mac.com
Value Network Mapping and Analysis is a tool developed by Verna Allee that displays a holistic picture of a system. This tool was brought to News Tools 2008 to:
• give those unfamiliar with the ‘traditional’ newsroom a clear map of how news was produced and value flowed;
• give those familiar with the “traditional” newsroom an explicit articulation of value flow in that system in contrast to emerging systems of news sourcing and distribution;
• give everyone a common “language” or “mapping tool” to consider the emerging news ecology and how new roles and value flows can help create a thriving environment.
The first step in the process is to identify roles in a system and the second step is to map the value flows.
Roles are real people or groups of people that generate transactions, send messages, engage in interactions, add value, and make decisions. The journalism maps include “reporter” “editor” “source” “community weaver” “advertisers”.
Once these roles were identified, we considered two kinds of value exchange:
Tangible value: All exchanges of goods, services or revenue, including all transactions involving contracts, invoices, return receipt of orders, requests for proposals, confirmations and payments are considered to be tangible value. Products or services that generate revenue or are expected as part of a service are also included in the tangible value flow of goods, services, and revenue.
A simple example is a customer (this is a role) goes to a store and buys groceries from the cashier (role). Money is paid in return for goods – vegetables. If the customer lives in a small town and has an ongoing patronage relationship with the cashier, there might be an intangible value exchange of information about their families and the neighborhood.
Intangible value: Two primary subcategories are included in intangible value: knowledge and benefits. Intangible knowledge exchanges include strategic information, planning knowledge, process knowledge, technical know-how, collaborative design and policy development; which support the product and service tangible value network. Intangible benefits are also considered favors that can be offered from one person to another. Examples include offering political or emotional support to someone. Another example is a research organization asking someone to volunteer their time and expertise in exchange for the intangible benefit of prestige by affiliation.
Once the roles and value flows are mapped, the picture of the whole system can be used to facilitate relationship management in an ecosystem, consider the business web and ecosystem development, consider options for process re-design, support communities of practice, or consider cost benefits and risks in existing and emerging systems.
For more information on Value Network Mapping, visit www.value-networks.com.

